Visualise your law firm’s data with Osprey Analytics and Osprey Case Management
Empower your employees to make confident, data-driven decisions using Osprey Analytics powered by Microsoft’s Power BI to visualise your law firm’s data. Centralise the information taken from your Osprey case management solution, as well as Excel files and other data sources, to gain a clearer view and clarity on your key metrics. Discover and share insights to help your firm meet goals such as improve client satisfaction, profitability, employee performance, client debtors and more.
Gain clarity and improve visibility of your firm’s performance

Interactive data
Easily and quickly view your KPIs and performance data and interact with the graphs to filter and sort data.

Connect multiple data sources
Centralise data from across your firm, even if it’s stored in Excel spreadsheets.

Easy customisable dashboards
Create your own custom interactive dashboards to share with your team.
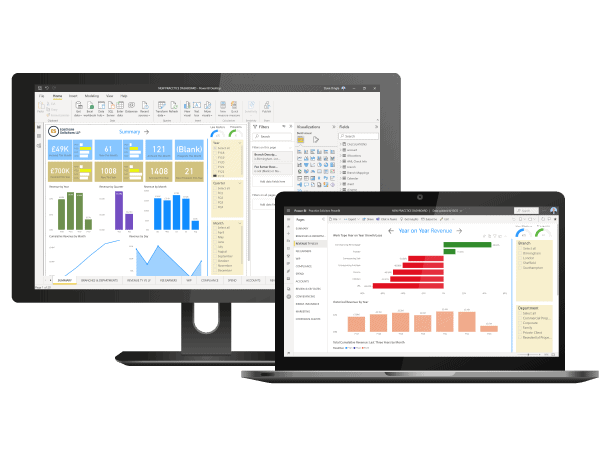
What is Osprey Analytics powered by Power BI?
Power BI enables you to connect and unify your law firm’s data into customisable, visual dashboards that provide business intelligence (BI) and insights into your firm’s performance. Easily build your own dashboards, from multiple data sources including Excel and Osprey Approach, to gain clarity on the data you store so you can make informed decisions to better meet goals. View top-level business metrics and drilldown to your branches, departments, teams, and individuals so you gain visibility and sharable insights.
Osprey Analytics key features:
Connect multiple data sources
Utilise the data stored in Osprey and connect other sources like Excel spreadsheets to create a unified picture.
Customisable dashboard templates
We provide a suite of core dashboard templates to get you started, but you can create your own reports using any graph or data point.
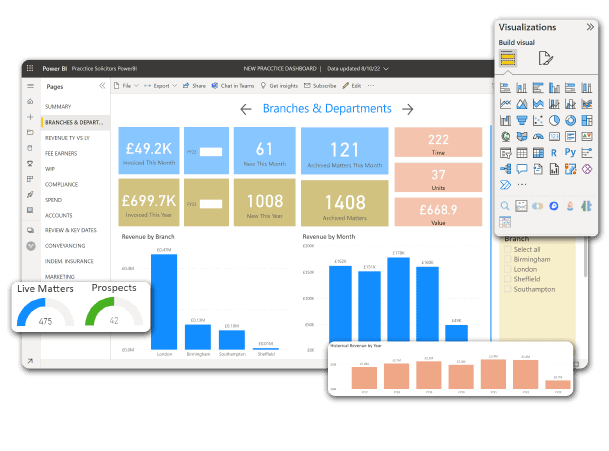
Easily segment data
Breakdown your data by branch, department, team, or individual and then by day, week, month, or year at the click of a button.
Visualise key metrics
Define your KPIs and create graphs and dashboards to easily visualise them so you can see if you’re on target to meet goals.
Interactive dashboards
Start with a bird’s-eye view of your performance then click on the graphs to manipulate the data within the dashboards to drill down and visualise specific metrics.
Additional reporting tools within Osprey
As well as the Power BI, Osprey includes – as standard – two other reporting options. The reports are customisable and can be scheduled to send to other team members via email.

Suite of core reports
Osprey includes a suite of standard reports for law firms across all practice areas. These help you to understand your business and client financials, case and client performance, time and costs, and employee targets.

Report designer
If you’re looking for a report that isn’t included in the core suite, you can use the report writer to build your own to export to Excel or PDF. Utilise any of the data you store in Osprey to create the report and graph you need.
Discover more…

How to utilise your data to exceed client expectations and improve ROI from your tech
CJ Anderson, from Iron Carrot, discusses how to utilise your firm’s data to improve ROI on your tech and exceed client expectations.
Find Out More
Becoming data-driven: How modern law firms can continuously improve with real-time data
For episode 1 of series 2 of Build Better Habits, our expert panel discussed how SME law firm can become more data-driven in their decision making to optimise operations and stay competitive.
Find Out More
Why you need to align your success measures to your law firm’s values
LPM’s annual Frontiers Report is a comprehensive analysis of business strategy for SME law firms. Discover themes of competition, tech, culture, and people.
Find Out MoreSee Osprey Analytics dashboards in action
Osprey integrates with your most loved business tools
Access better software support and an all-in-one solution
Upgrade your practice and case management system today, to Osprey, and make it easier to run your firm. Book an initial demo to see the software in action, get pricing details, and information on our implementation and data migration services.
